Homecare Homebase’s Analytics platform allows you to track and analyze data in order to gauge your organization’s clinician satisfaction. In our recent webinar, Homecare Homebase and Home Health Care News discuss key indicators to help you track clinician satisfaction and improve retention. Brandy Sparkman-Beierle, Jon Higginbotham and Benjamin Hayes discuss how to dig into data to learn which clinicians, branches and processes can be improved to create a more engaged workforce. They also share Homecare Homebase’s latest clinical management resource and tips for leveraging satisfaction data.
Watch the webinar and read on to learn the following:
- What metrics you should track to gauge clinician satisfaction
- Tips for analyzing clinician satisfaction data on company-wide, branch and clinician levels
- How to engage your staff to improve retention
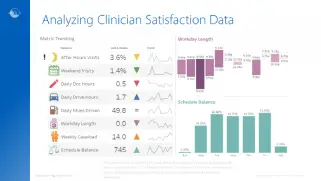
At Homecare Homebase, clinician experience and satisfaction is our number one initiative, which has led to the creation of our HCHB Analytics clinician satisfaction dashboard in order to predict at-risk clinicians. This tool alerts clinical leadership when a clinician is “in-the-red”, evaluating eight metrics that HCHB found through correlation analysis to be contributors to clinical satisfaction. The metrics include:
- After hours visits – percentage of visit points between 6pm and 6am
- Weekend visits – percentage of visit points on Saturday or Sunday
- Daily documentation hours – average hours spent on additional documentation time each day
- Daily driving time – average hours spent driving to visits each day
- Daily miles driven – average mileage driving to visits each day
- Workday length – average hours between first and last visit each day
- Weekly caseload – average distinct patients visited each week
- Schedule balance – number between 0–1000 calculated based on the standard deviation of weekday visits for each week
Customers can view this information at the clinician, branch, and agency level. Watch the webinar to view a live demo of the dashboard.
The clinician scorecard within the dashboard allows you to look at a single clinician at a time and see where they stand on each metric. The clinician compare view allows you to analyze each clinician’s scores and where they stand within the eight metrics as in relation to all other clinicians in their branch. Branch compare allows you to pull back even further to get a bird’s eye view of how clinicians may be doing across organization.
Homecare Homebase’s Analytics platform allows you to track and analyze data in order to gauge your organization’s clinician satisfaction. In our recent webinar, Homecare Homebase and Home Health Care News discuss key indicators to help you track clinician satisfaction and improve retention. Brandy Sparkman-Beierle, Jon Higginbotham and Benjamin Hayes discuss how to dig into data to learn which clinicians, branches and processes can be improved to create a more engaged workforce. They also share Homecare Homebase’s latest clinical management resource and tips for leveraging satisfaction data.
Watch the webinar and read on to learn the following:
- What metrics you should track to gauge clinician satisfaction
- Tips for analyzing clinician satisfaction data on company-wide, branch and clinician levels
- How to engage your staff to improve retention
At Homecare Homebase, clinician experience and satisfaction is our number one initiative, which has led to the creation of our HCHB Analytics clinician satisfaction dashboard in order to predict at-risk clinicians. This tool alerts clinical leadership when a clinician is “in-the-red”, evaluating eight metrics that HCHB found through correlation analysis to be contributors to clinical satisfaction. The metrics include:
- After hours visits – percentage of visit points between 6pm and 6am
- Weekend visits – percentage of visit points on Saturday or Sunday
- Daily documentation hours – average hours spent on additional documentation time each day
- Daily driving time – average hours spent driving to visits each day
- Daily miles driven – average mileage driving to visits each day
- Workday length – average hours between first and last visit each day
- Weekly caseload – average distinct patients visited each week
- Schedule balance – number between 0-1000 calculated based on the standard deviation of weekday visits for each week
Customers can view this information at the clinician, branch, and agency level. Watch the webinar to view a live demo of the dashboard.
The clinician scorecard within the dashboard allows you to look at a single clinician at a time and see where they stand on each metric. The clinician compare view allows you to analyze each clinician’s scores and where they stand within the eight metrics as in relation to all other clinicians in their branch. Branch compare allows you to pull back even further to get a bird’s eye view of how clinicians may be doing across organization.

The setup view gives you tools to better understand what a population of clinicians looks like (employee vs contractor, etc.). You can filter them by specific groups, branches, and scores; and even save custom views.
Ultimately, the dashboard allows you to view metrics that could lead to burnout for clinicians. You must analyze each score strategically as it pertains to your organization, considering the below:
- What did I hire this clinician to do and during what hours?
- What does “after hours” mean at my organizations?
- How am I scheduling clinicians for visits?
The clinician satisfaction score does not necessarily determine clinician happiness, rather, it identifies areas that correlate to a clinician’s retention. Most clinical turnover takes place within 6-18 months, so it is important to pay close attention to satisfaction scores for new employees and consider ways to improve your onboarding and retention strategies.
How are you able to measure data points related to clinician satisfaction?
HCHB is tracks documentation hours, driving hours, and hours spent inside the patient’s home as part of our EHR solution. Customers with HCHB Analytics are able to pull information directly from Homecare Homebase into our analytics tool powered by Tableau.
How can I use this data to improve clinician satisfaction and retain employees?
When focusing on retention, it is important to look at these data points as opportunities for improvement. Home health has a high turnover rate as an industry. With the overall staffing shortage we are experiencing, the more you can retain, the better.
Start by looking at factors that could be impacting your overall satisfaction score within the 6-18 month range from the branch level, as well as reviewing at-risk clinicians individually. The following factors are a great place to start.
- How much time is being spent outside of the home documenting?
- Hiring practices and the expectations as outlined in clinician contracts
- How much time is actually being spent with patients?
How can organizations empower clinicians to document more efficiently?
HCHB partners with nVoq, a talk-to-text tool that helps drive a lot of the narrative documentation that needs to be done post-visit, helps to automate this process and allows clinicians to document on the go. Additionally, HCHB partners with MedBridge to teach OASIS and home therapy exercise programs.
A careful look at your orientation and education programs is essential to helping your clinicians become productive as quickly as possible.
Why are clinicians resigning?
Home health clinician turnover rates remain high and clinicians are often finding better pay as contractors than employees. There are, however, areas that your organization can improve to increase retention. If clinicians are empowered to document quicker, this alleviates the stress that comes with meeting deadlines. Additionally, look at what brings clinicians to your organization and what makes them leave, then form your programming around these factors.
Make sure you have a plan to regularly show clinicians appreciation for the work they do and engage with them. Lastly, evaluate whether your organization is strategically placing people in the right roles based on their personality, goals, skill sets, and geographic locations in order to optimize your current staff.


Scheduling factors are a key driver of clinician satisfaction. If your agency is looking for ways to address scheduling challenges, you may be interested in learning more about HCHB Smart Scheduling, our scheduling automation solution. Smart Scheduling can automate up to 98% of home health visits and 96% of hospice visits while taking important factors like continuity of care, clinical availability and clinical capacity into account.
Careful attention to clinical risk factors and staff optimization can increase in retention and satisfaction. Visit our website for more information on HCHB Analytics or contact your HCHB representative to discuss ways we can tackle clinician satisfaction together.