
Home-based care organizations are under constant pressure to balance growth, quality, and compliance across service lines.
Whether delivering short-term skilled care in home health or supporting patients and families through hospice, planning has become more complex. Between PDGM reimbursement dynamics, evolving hospice requirements like HOPE, and increasing Medicare Advantage influence, relying on intuition alone is no longer enough.
Data-driven planning helps agencies stay aligned, proactive, and prepared across the full continuum of care.
What is data-driven planning in home-based care?
Data-driven planning is the process of using clinical, operational, and financial data to guide decisions across home health, hospice, and other home-based care services.
Instead of reacting to issues after they occur, organizations use analytics to:
- Identify trends early
- Understand performance across service lines
- Align staffing and scheduling with patient needs
- Understand how regulatory changes could affect the agency
- Create improvement plans for care quality and operational efficiency
In practice, this means connecting insights from referral to billing and creating a unified view that supports better decisions at every level.
Plan using clinical performance and patient outcomes metrics
Analytics provides visibility into how care is performing across home health and hospice. Standardized dashboards and reporting allow organizations to identify trends in outcomes, documentation quality, and care delivery consistency.
This type of insight allows clinical and operational leaders to evaluate performance over time, compare across clinicians, teams, or branches, and identify areas where additional focus or process improvement may be needed.
Two performance measures that are often the focus of data analysis include:
- Acute care utilization
- Potentially preventable hospitalization
Acute care utilization is a category that refers to the use of services such as emergency department visits, observation stays, inpatient admissions and hospitalizations. Potentially preventable hospitalization (PPH) is a measure that is a subset of acute care utilization. It specifically applies to unplanned hospital events that may have been avoided through effective care management, monitoring, and coordination. This measure is included in the CMS Expanded Home Health Value-Based Purchasing Model. Analytics can support tracking and evaluating both Acute care utilization and PPH by examining historical performance trends.
In hospice, analytics also provides visibility into patterns related to visit delivery, documentation completeness, and alignment with required care processes, helping teams assess consistency across the interdisciplinary model.
By grounding decisions in consistent performance data, organizations can make more informed planning decisions, prioritize improvement efforts, and better understand how care delivery measures are trending over time.
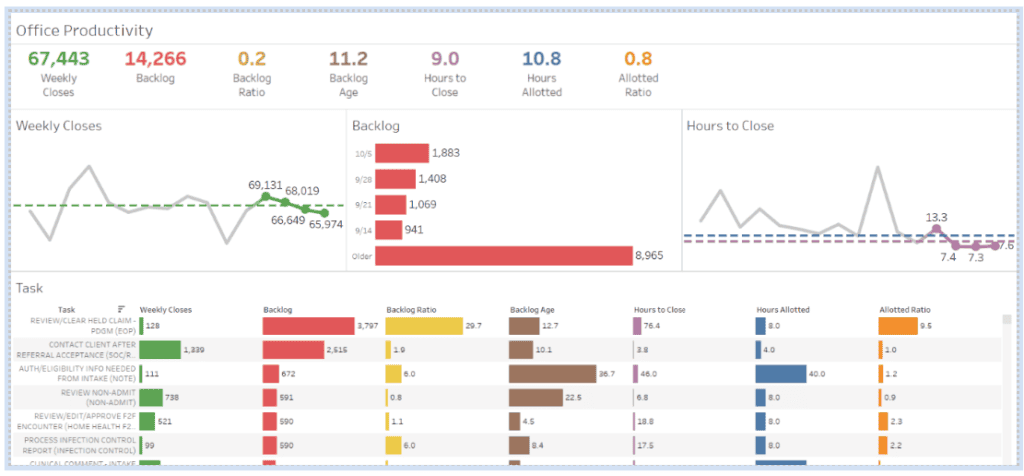
Operational efficiency and workforce planning
Staffing challenges impact every home-based care setting. Data can be leveraged to address and plan for potential staffing issues and tackle recruitment or turnover challenges.
Analytics helps organizations:
- Track clinician productivity and visit utilization
- Examine clinical capacity and identify staffing needs
- Identify scheduling inefficiencies such as workload balance issues
- Identify potential burnout risks for clinicians
With better visibility, teams can support clinician experiences and identify opportunities to increase retention and reduce burnout.
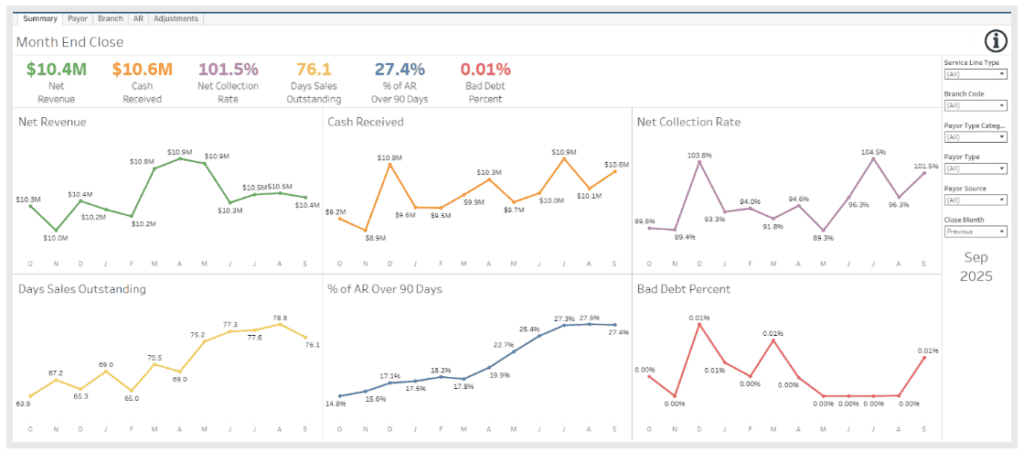
Financial performance and revenue cycle visibility
Financial performance is closely tied to both clinical accuracy and operational execution.
Analytics supports:
- Monitoring DSO trends and cash flow performance
- Identifying sources of claim delays or denials
- Tracking billing readiness and documentation completeness
- Understanding revenue drivers across service lines
In home health, this often centers on PDGM performance and LUPA management. In hospice, it includes compliance with benefit requirements that impact reimbursement. These insights help organizations identify financial performance trends, prioritize improvement areas, and make more informed planning decisions before issues impact revenue.
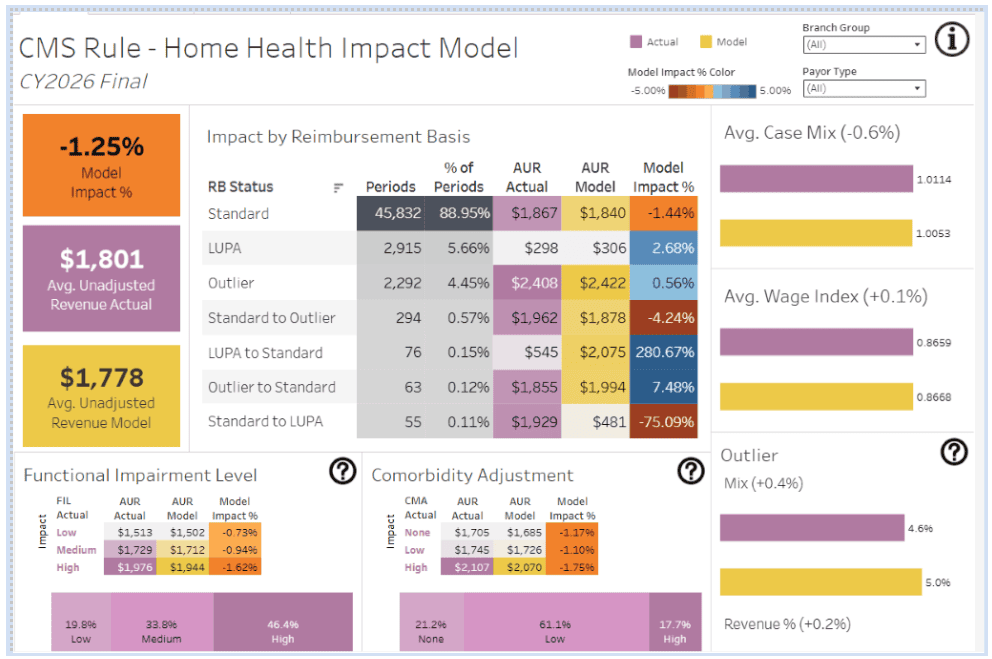
Compliance and regulatory readiness
Home-based care is a complex and ever-changing regulatory environment. Every year, CMS releases new proposed and final rules as well as other regulatory updates that affect the bottom line of home health and hospice agencies. Leaders must understand how new regulations will affect the organization financially, as well as operationally. Dashboards like the HCHB Analytics Impact Models can help leaders anticipate the potential effects of regulatory change in time to pivot and avoid financial pitfalls.
Moving from reporting to actionable insight
Many organizations have access to reports but struggle to turn that information into action. The difference is how analytics are delivered and used.
Effective analytics should be:
- Timely and easy to interpret
- Accessible across roles and service lines
- Examined from multiple perspectives
When data becomes part of how teams work, it supports better coordination between the field and the back office.
Creating actionable insights through benchmarking
The sheer amount of data and detail available today can be overwhelming, so it is important to prioritize the metrics that matter most when planning. Agency leaders can ask the following questions to make sure you are analyzing the right data.
- What metrics hold the highest value?
- Are they measurable? How can you make them measurable?
- Are they actionable? What will you do to spur improvement?
Approaches to benchmarking
It is difficult to measure progress or goal completion without first establishing benchmarks. Analysts recommend considering a mixture of internal and external benchmarks to understand how the company is progressing, as well as its performance compared to other home-based care organizations.
Depending on the agency size, internal benchmarks could compare:
- Branch locations
- Teams
- Case Managers
When setting external benchmarks, organizations can utilize data from CMS, data provided by the EHR or other market data resources. HCHB medians in HCHB Analytics are an example of EHR provided data that can be used for external benchmarks. These data points allow an agency to compare its performance for a metric against the average for HCHB customers of comparable size.
4 Tips for setting and monitoring targets
After setting benchmarks, agencies should consider the following when setting targets and monitoring progress:
- Targets should be realistic, achievable, and sustainable. Where possible, take market volatility into account for each benchmark.
- Focus on problem areas and manage by exception. Use color in analytics dashboards to draw attention to problem areas quickly.
- Consider setting up alerts or push reporting for key metrics. Alerts and push reporting help key team members monitor progress.
- Set up a consistent process for reviewing metrics. Have a clear plan that states who should be looking at which metrics and how often. Include processes to hold people accountable for meeting targets that are tied to these metrics.
The role of AI in modern home-based care analytics
Analytics is evolving beyond dashboards into more proactive, insight-driven support.
AI-enabled capabilities can help organizations:
- Surface patterns across clinical and operational data
- Predict potential risks, such as hospitalization likelihood
- Recommend next best actions based on patient needs
This progression from descriptive to predictive and prescriptive insight, supports more confident planning across both home health and hospice. Importantly, these tools must be designed to support clinicians and operators, not replace them. Human oversight should remain central to every decision.
Homecare Homebase has introduced insight-driven support for clinicians with Predict: Hospitalization Risk, an AI-powered product that provides care team members with real-time risk scores. The goal is to empower clinicians with the frontline insights they need to make smarter decisions, provide faster interventions, and ultimately improve patient care.
Building a stronger foundation for growth across service lines
Data-driven planning creates clarity, not just within a single service line, but across the entire organization.
With a unified view of performance, agencies can:
- Make more informed strategic decisions
- Adapt to regulatory and reimbursement changes
- Support clinicians with better tools and insights
- Deliver more consistent, high-quality care
As home-based care continues to evolve, that clarity becomes essential for sustainable growth.
Start building a more data-informed approach
Every organization has data. The opportunity is turning that data into meaningful, actionable insight across home health, hospice, and beyond. By aligning analytics, teams can move from reactive management to a more proactive, connected approach to planning. That’s how organizations spend less time searching for answers and more time focusing on what matters most: delivering care.