Operating a home health agency without real-time access to business metrics is like driving on a dark road without headlights. You move slowly and defensively, unable to prepare for dangerous curves or plan an alternate route. That’s no way to drive, and certainly no way to run a successful home health agency.
The business intelligence provided by HCHB Analytics’ workbooks shine a light on your agency’s operations. Our analytics platform helps you make informed, data-driven decisions that help you improve patient outcomes, increase organizational efficiencies, and monitor the critical KPIs that define your success.
Real-time Monitoring Supports Informed Decision Making
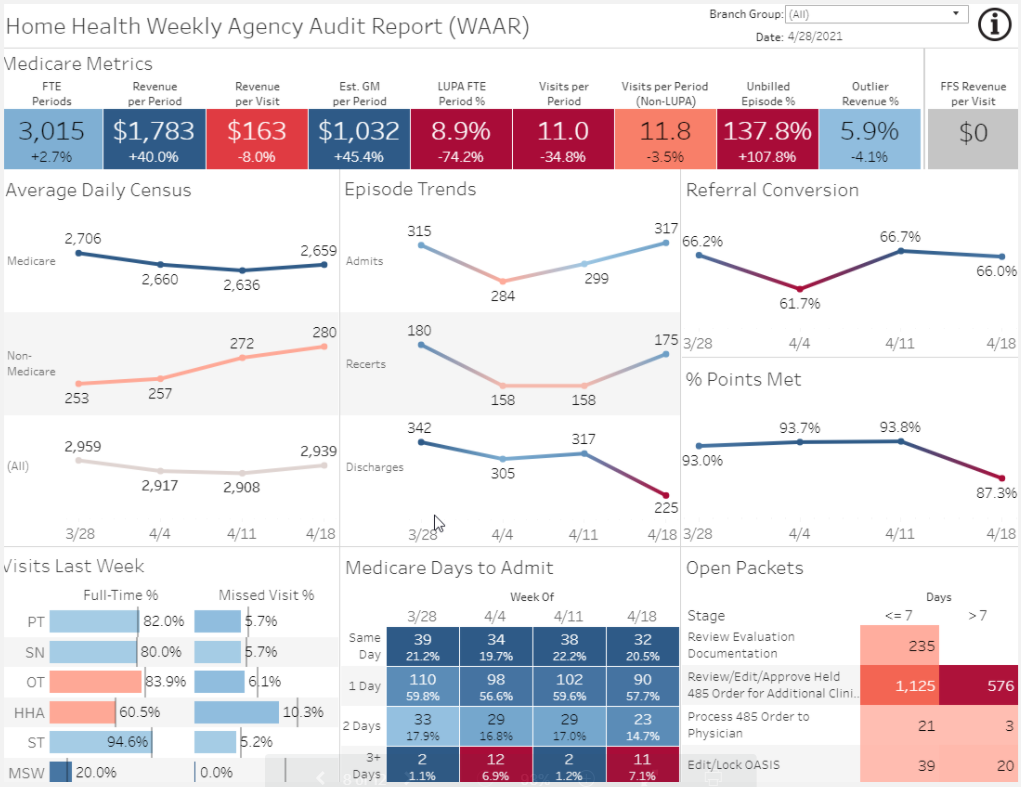
The “Weekly Agency Audit Report” (WAAR) provides a high-level snapshot of how the agency (or individual branch) is functioning. Its color-coded highlights provide insight into important metrics, including:
- Financial: Revenue totals are calculated per period and per visit. Track Medicare vs. non-Medicare patient totals. Calculate estimated gross margin. Monitor unbilled episode percentages and more.
- Patient metrics: Average daily census, admissions/recerts/discharges and referral conversion totals are reported in 4-week increments to help identify trends. You also have LUPA and non-LUPA data on FTE periods.
- Productivity: Monitor in-field and back office activities with statistics on Medicare days to admit, open packets, visits per period, and points met percentages.
Here’s an example:
Track Outcomes and Care Quality Statistics
CMS payment models are increasingly focused on outcomes rather than fee-for-service. The Home Health Quality Reports dashboard provides outcomes information using current data drawn from CMS and your own agency.
You get that and more with this dashboard. It tracks improvement, prevention, and utilization efforts, as well as highlighting areas where your agency excels. You can also use the Home Health Quality dashboards to analyze where/why you’ve had a dip in a quality measurement. You can track your information on a daily basis and drill all the way down to patient details.
The HHQR breaks down specific outcomes in three main categories:
Improvement: Ambulatory/locomotion, bathing, transferring, etc.
Prevention: Diabetic foot care, flu immunization, pain management, etc.
Utilization: Emergent care (with and without hospital admission), discharge to community, and timely initiation of care.
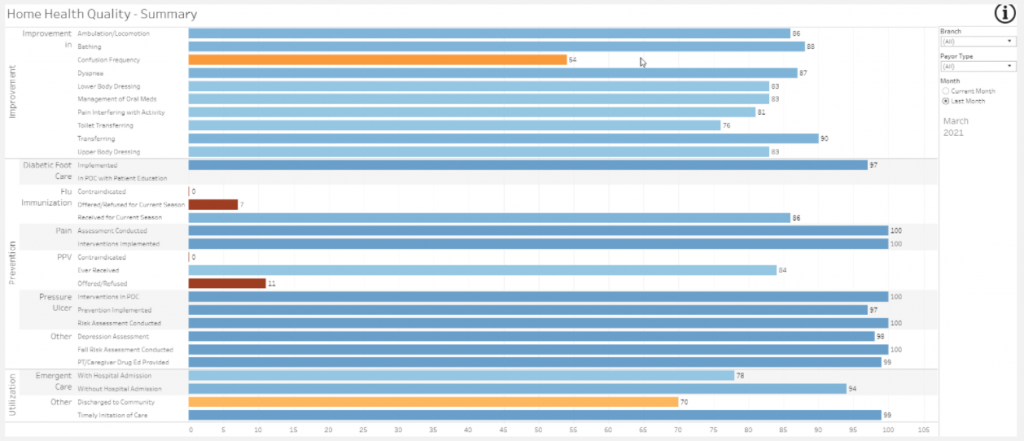
Users can customize the report for their individual needs and view quality outcome results by agency branch, payor type, and month. Each individual measurement bar is “clickable” so you can drill down to see trends and details by Case Manager.
Monitor Field and Office Productivity Metrics
Do you have the right people providing the right care in the field? HCHB’s Caregiver Optimization dashboard can tell you. It provides an analysis of visits that could be done by a higher or lower cost caregiver. The totals on the left are an estimate of total profit loss from non-optimized visits during the past 12 months.
The dashboard breaks out utilization by specialty to help you optimize staffing levels. Personnel costs are the highest expense in home health care, so it’s important to use staff time as efficiently. Your “non-optimized visits” numbers illustrate how much you could be losing by sending higher-skilled workers on visits. That directly affects your bottom line and your agency’s long-term financial health.
Customize the report using the drill down options for branch location, payor, and service type. Modify job code costs to match your agency’s labor costs.
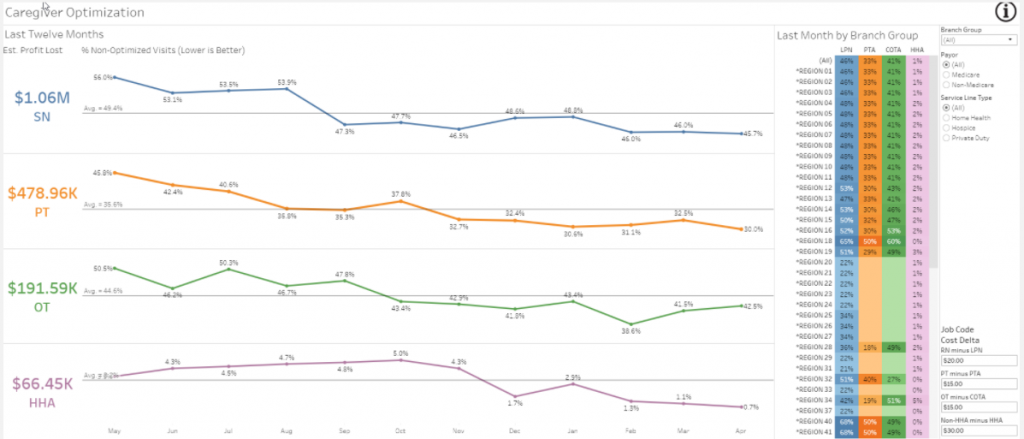
Every agency is struggling with personnel shortages and labor costs. The Caregiver Optimization dashboard can help you use existing staff more efficiently and control costs.
Monitor Field and Office Productivity Metrics
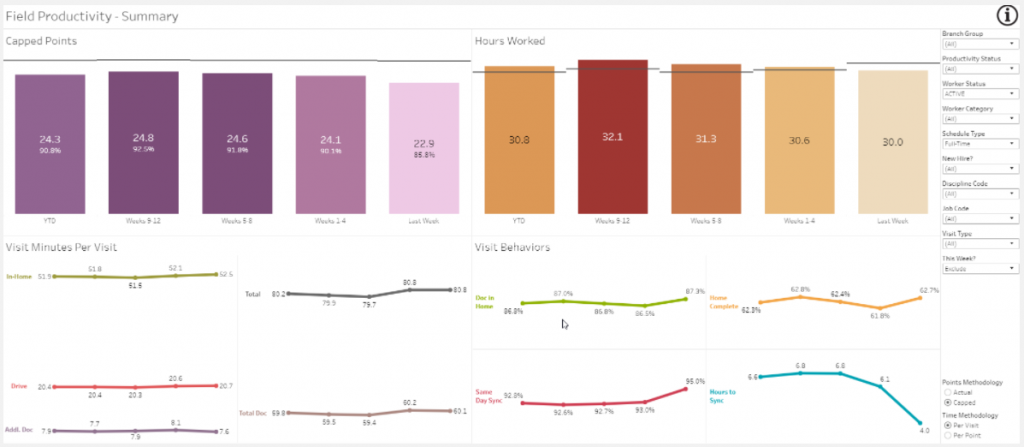
Our Field Productivity dashboard helps you measure the efficiency of clinicians and other field staff. It provides hard and fast data needed to objectively address problem areas.
Track aggregate measurements for the agency as a whole and for individual clinicians. We measure productivity by the time and/or points systems and record time in-home, sync timing and success, drive time, and documentation time.
Office productivity directly affects patient intake, billing, and payment. Boosting performance in those areas can help you improve cash flow. Use the Office Productivity dashboard to monitor backlog ratio and age, hours to close, hours allotted, and receive reports on the types of tasks that have been completed. Monitor critical tasks that hold up workflow and improve processes.
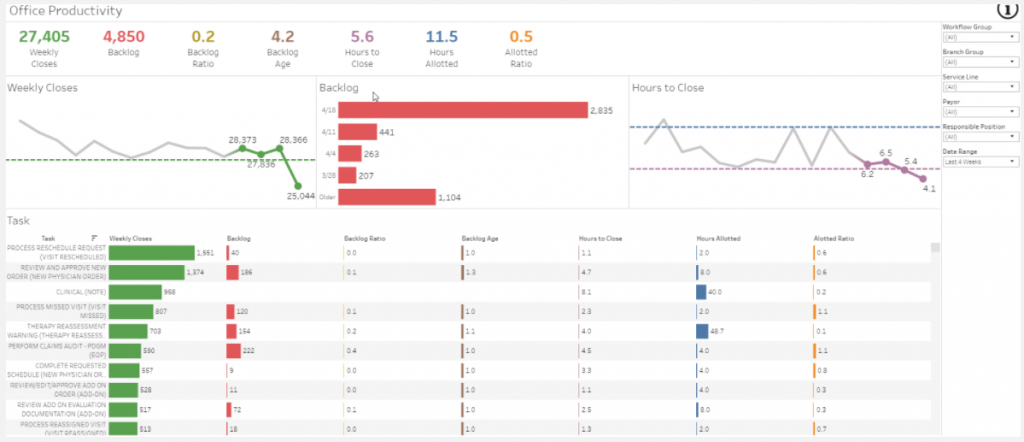
The field and office productivity metrics give you a crucial look under the hood of your operations.
Improve Patient Outcomes and Satisfaction
Our Continuity of Care dashboard was created in conjunction with HCHB Smart Scheduling, but the information is so important that we make it available to all HCHB Analytics customers as well. The Continuity of Care dashboard helps you track how many people from each job code are seeing patients. For example, are you generally sending out 4 different RNs to see a patient, or is the patient getting the opportunity to build closer relationships by seeing the same RNs during each visit?
We noted in our report on 2021 Home Health Technology Trends that studies have highlighted the importance of continuity of care for both caregivers and patients:
“Analyses of data from a large population of home health patients suggest that greater consistency in nursing personnel decreases the probability of hospitalization and emergent care, and increases the likelihood of improved functioning in activities of daily living between admission and discharge from home health care.”
Patients and caregivers alike prefer to establish long-term relationships that engender trust. It increases both patient and caregiver satisfaction, which is a win/win for your agency.
- Patient satisfaction is an important component of CMS quality ratings.
- Employee satisfaction is tightly linked to retention, which is critical for many agencies that struggle to attract and retain qualified clinicians.
There is a tension between optimizing field productivity and maintaining continuity of care. Scheduling is a much more complex task when you add caregiver continuity into the mix of variables. HCHB Smart Scheduling can help you manage the scheduling process.
Improve Executive-level Decision Making
In 2005, Wharton business professor Lawrence Hrebiniak identified the top three reasons corporate strategies fail: “execution, execution, execution.” That’s because most managers “know a lot about how to decide on a strategy, and very little about how to carry it out.”
HCHB Analytics gives executives the information they need to make important business decisions.
- Compare regional and branch performance in key metrics.
- Create goals and benchmarking targets.
- Monitor performance to budget goals for each branch and region.
The home health industry is changing so quickly that managers can no longer rely solely on their instincts and experience to craft strategy and make important decisions. Analytics data is even better than driving with your headlights on. It illuminates the whole business landscape, allowing you to make fact-based decisions based on real-time numbers and performance data.
Contact us to learn more or schedule an in-depth conversation about what Homecare Homebase and HCHB Analytics can do for your team.