Compliance risk rarely announces itself with a flashing red light. More often, it appears as a pattern: documentation that takes a little longer to complete at one branch, orders that remain unresolved longer than expected, unusual utilization patterns, or exceptions that repeatedly require manual intervention.
Individually, those issues may not look significant. Across an organization, however, they can reveal where a process isn’t working as intended. That’s where analytics can become an important part of home health and hospice compliance strategy.
Used effectively, analytics can help leaders move beyond retrospective reporting and create an early-warning system for operational and compliance risk. Instead of waiting for a survey, audit, denial, or quality issue to reveal a weakness, organizations can use their own data to identify exceptions, investigate variation, and determine whether corrective action is needed.
The goal is to make potential risk visible early enough to understand it.
From compliance reporting to compliance intelligence
Home health and hospice organizations generate enormous amounts of clinical, operational, quality, and financial data. The compliance opportunity comes from connecting those data points to the processes leaders need to monitor.
For example, analytics can help an organization examine:
- Documentation completion and exception rates
- Order aging and signature completion
- Billing holds and resolution times
- Start-of-care and admission timeliness
- Visit and utilization patterns
- Recertification activity
- Discharge and transfer trends
- Hospice live discharge and revocation patterns
- Referral concentration and associated utilization patterns
These aren’t automatically measures of compliance or noncompliance. Instead, they can act as signals that tell leaders where to look more closely. Variation may be clinically appropriate and well supported. Different patient populations, staffing models, markets, case mix, and workflows can produce legitimate differences among branches or teams. An outlier should therefore prompt investigation, not an automatic conclusion that something is wrong.
Can we identify unusual patterns, understand what’s driving them, and demonstrate an appropriate response when necessary?
That approach aligns analytics with a broader model of continuous survey readiness. A survey-ready organization needs to be able to identify risk, assign ownership, surface exceptions, and verify that corrective actions are effective. Analytics can provide the visibility needed to support that process.
The hidden compliance risk of averages
One of the easiest ways for compliance risk to remain hidden is also one of the most familiar ways organizations measure performance: the enterprise average. Imagine a multi-branch organization with a 95% documentation-completion rate. That sounds strong. But what does 95% actually mean?
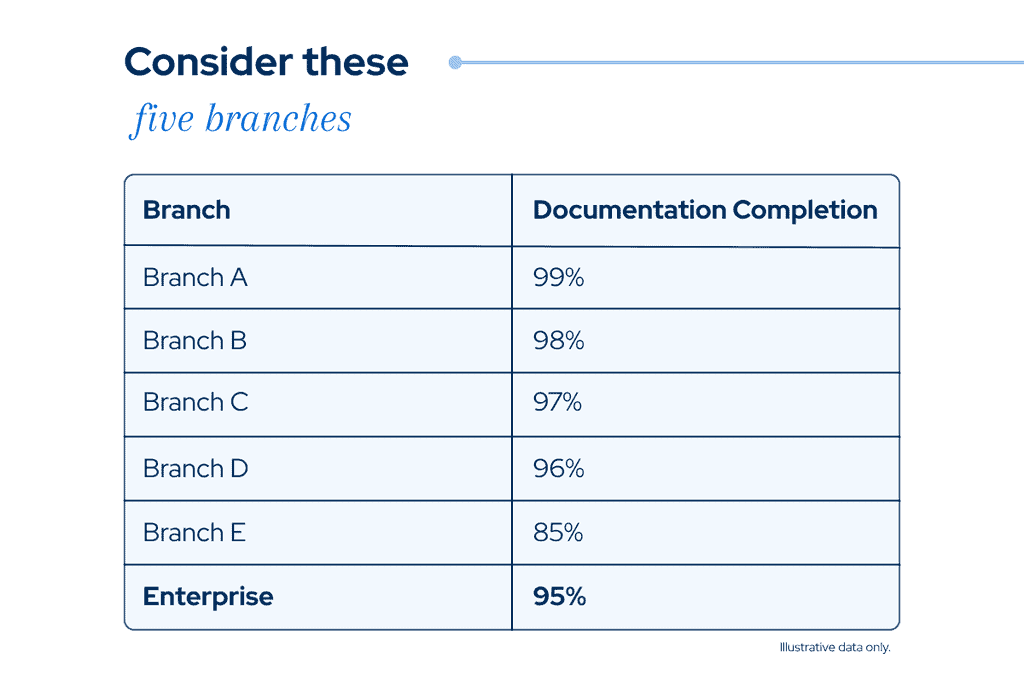
At the enterprise level, leadership sees 95%. At the branch level, leadership sees a very different story. Four branches are performing at 96% or better, while one is at 85%. The enterprise average hasn’t changed, but understanding the variation underneath it changes the operational picture considerably. That is the hidden risk of averages.
Enterprise dashboards are useful for understanding overall performance, but an aggregate number can make very different operations look the same. If leaders stop at the enterprise number, a persistent issue at a particular branch, team, or service line can remain obscured. The answer is to create a disciplined process for drilling past the surface level.
Go from enterprise visibility to operational visibility
Effective compliance analytics should help leaders ask progressively more specific questions. If an enterprise metric moves unexpectedly, what’s happening at the branch level? If one branch is an outlier, is the variation concentrated within a particular team or discipline? Does it correspond with certain patient populations, referral sources, workflows, or service lines?
This type of analysis can be particularly valuable for multi-site home health and hospice organizations because compliance processes ultimately happen at the operational level. Drilling down can help leaders distinguish an isolated exception from a recurring pattern. The next step is equally important: understand why the variation exists.
A metric alone doesn’t provide that answer. An outlier could reflect a legitimate difference in patient acuity or case mix. It could point to a staffing or workflow issue. It could identify a need for education or additional review. In some circumstances, it may warrant a formal quality assessment and performance improvement (QAPI) initiative.
Analytics can tell leaders where to look. Clinical, compliance, operational, and financial expertise provides the context needed to decide what the data means and what, if anything, should happen next.
Home health compliance analytics: Look for the operational story
For home health organizations, analytics can help connect regulatory requirements with what is actually occurring in daily operations.
Leaders might monitor documentation exceptions, order aging, start-of-care timeliness, recertification patterns, discharge and transfer trends, and visit utilization. Utilization data deserves particular care.
A utilization pattern isn’t inherently positive or negative. Visit frequency and discipline mix should align with individual patient needs and the plan of care. Analytics can help leaders identify variation that warrants investigation and determine whether the clinical record supports the care delivered.
The same principle applies to Low Utilization Payment Adjustment (LUPA) patterns. LUPA data has financial significance under the Patient-Driven Groupings Model (PDGM), but the underlying story may involve missed visits, scheduling, changes in patient need, or other clinical and operational factors. Analytics should help leaders understand that story.
Home health leaders can also examine assessment and quality data alongside operational metrics. With OASIS-E2 now part of home health operations, consistent assessment processes, accurate data, and appropriate submission workflows are part of the broader control environment.
Hospice compliance analytics: Understand the patterns behind the claims
Hospice presents a different set of analytics opportunities. Leaders may want to monitor recertification patterns, live discharges and revocations, length-of-stay patterns, referral concentration, documentation exceptions, and other indicators that could warrant additional review.
Claims-based patterns have become particularly important with CMS’s Special Focus Program Simplified Vulnerability Index (SSVI). The methodology uses claims-based measures to identify hospices that may warrant greater scrutiny. A higher SSVI score signals potential concern; it isn’t, by itself, a determination that fraud or noncompliance occurred. Claims patterns don’t necessarily explain the clinical or operational circumstances behind the data. Patient population, referral environment, geography, length-of-stay distribution, and clinical complexity can all influence results.
Hospice leaders can establish baselines, monitor trends, and investigate unusual patterns using both claims data and clinical context. That can help compliance, clinical, operational, and financial teams understand the same issue together before an outside reviewer asks them to explain it. Analytics can also support oversight of time-sensitive processes. With HOPE now part of day-to-day hospice operations, organizations need consistent execution around assessments, Hospice Update Visits, symptom follow-up, and quality-data submission. Monitoring those workflows can help leaders identify exceptions before they become persistent process problems.
Put your analytics to the test
When reviewing performance data, leadership teams can use the following set of metrics and questions to evaluate whether their organization has enough visibility to support audit and survey readiness.
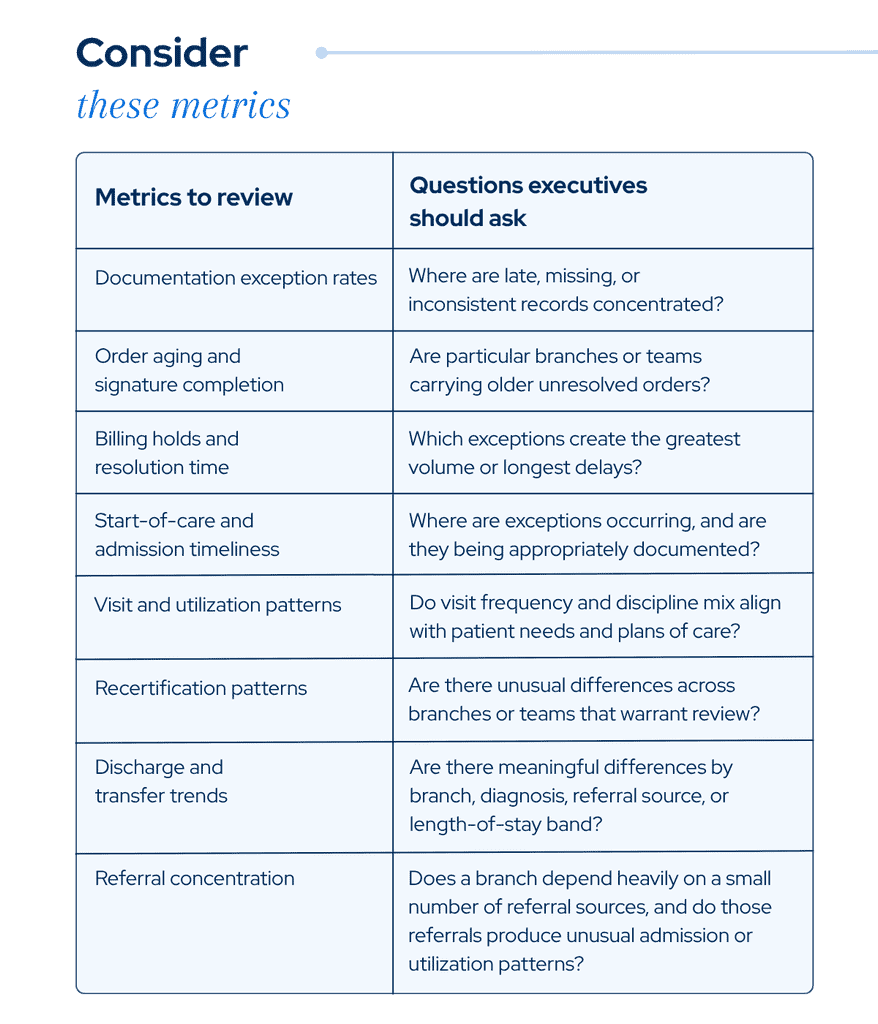
The answers to these questions will help leadership decide if they can effectively examine the operational activity underneath an enterprise result. If a concerning pattern appears, can the organization determine where it originates? Can leaders identify an owner? Can the team investigate the underlying records or workflows? And, when action is required, can leadership verify that the intervention worked? Those are important capabilities for an organization that wants to be survey-ready every day.
How HCHB Analytics can support compliance visibility
Up to this point, we’ve been talking about analytics as a general compliance management discipline. The principles apply regardless of the technology an organization uses. HCHB Analytics refers specifically to HCHB’s analytics offering, including hundreds of stock dashboards tailored to the needs of specific teams from executives to operations, clinical leadership and billing staff. Organizations can also choose to build their own custom dashboards to fit their specific needs.
For multi-site organizations using Homecare Homebase, HCHB Analytics provides branch-level operational visibility that helps leaders move from anecdotal compliance management toward measurable exception management. Leaders can use analytics to monitor areas such as documentation completion, order status, billing holds, claims exceptions, and other high-risk trends across locations. That ability to move between organizational and more granular views is especially useful when an enterprise average looks acceptable but may be masking a localized issue.
HCHB Analytics can also support proactive monitoring through alerts that notify hospice leaders when selected measures reach a defined threshold. Leaders can then investigate the pattern and cause rather than discovering the trend for the first time during external scrutiny. The larger advantage comes from connecting analytics with the surrounding clinical, operational, and revenue-cycle environment.
Analytics alone don’t create compliance. Technology also doesn’t replace clinical judgment or compliance oversight. But when analytics, workflows, alerts, guardrails, and audit trails work together, technology can help organizations make important processes more visible and consistent.
Don’t wait for the survey to find the exception
Traditional compliance monitoring can become heavily retrospective: review what happened, identify what went wrong, and correct it. Analytics creates an opportunity to move some of that work upstream.
When leaders routinely monitor exceptions and variation, they can ask questions before an outside reviewer does. They can look beyond enterprise averages, identify unusual patterns, investigate their causes, and determine whether controls are working as intended.
That doesn’t mean every outlier is a compliance problem. And it doesn’t mean every metric should trigger intervention. It means leaders have greater visibility into what’s happening across the organization and a more structured way to determine what deserves attention.
For home health and hospice providers navigating increasingly interconnected quality, payment, program-integrity, and survey expectations, that visibility can become an important part of continuous readiness.
Learn more about HCHB Analytics to see how data can help your organization turn operational information into actionable visibility.
Read the full Survey-Ready Every Day report for additional strategies, exercises, and tools to help home health and hospice leaders build regulatory readiness into everyday operations.